Discover tutorials, user manuals, and more.
Overview
The Console Dashboard serves as your central center for efficiently controlling and monitoring cloud resources. Pico Public Cloud will take you to the Customer Dashboard once your authentication and login have been completed successfully. The welcome widget displays your last login information, as well as the last invoice details and total due payments.
Additionally, the resource summary graph will display the total number of cloud resources, such as virtual instances, volumes, and IP addresses. Separate graphs will display separate records for multiple cloud resources.
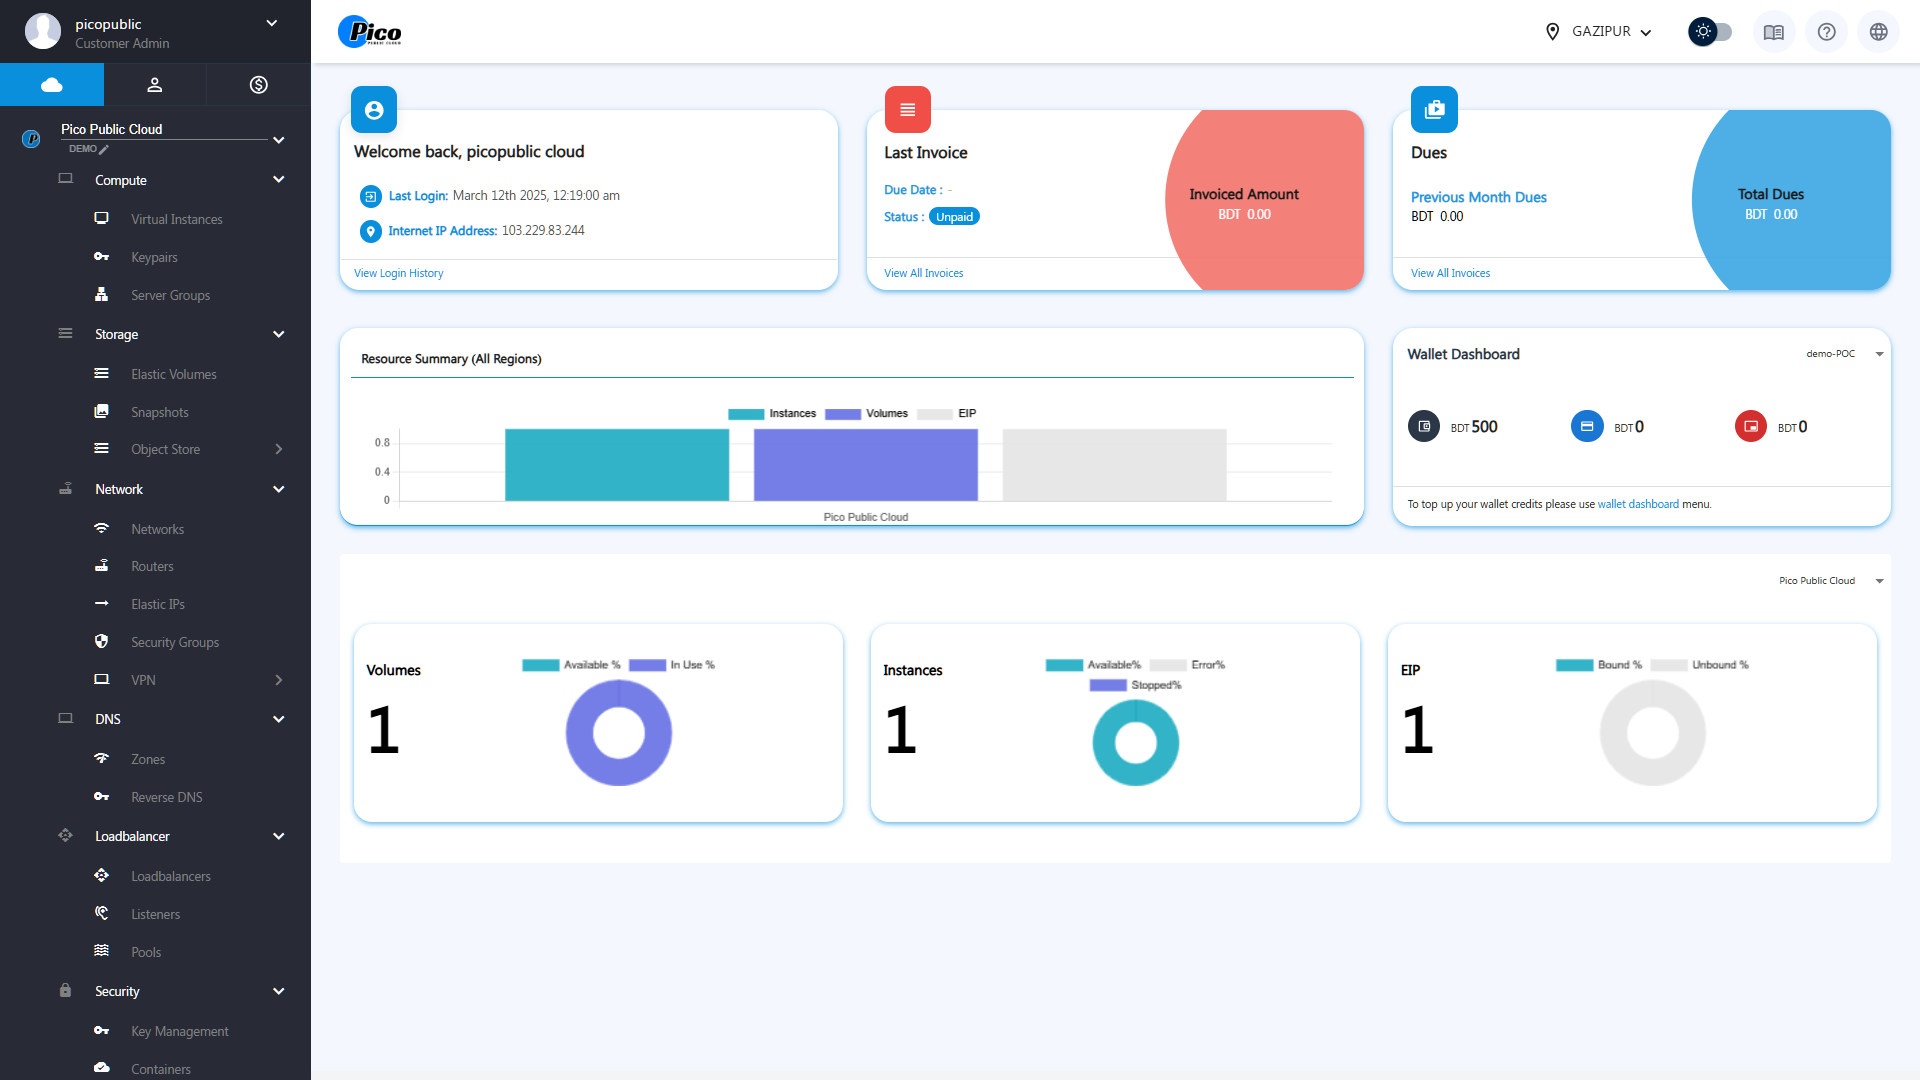
- Welcome Panel – See your last login time and IP address at a glance.
- Last Invoice and Dues – Quickly check your latest invoices, due amounts, and wallet balance so you’re always in control of your costs.
- Resource Summary (All Regions) – Get a real-time overview of your Instances, Volumes, and Elastic IPs (EIPs) across all regions, displayed graphically.
- Wallet Dashboard – Shows the available credits
- Volumes – Track available and in-use storage resources.
- Instances – Monitor VM availability, stopped status, and errors.
- Elastic IP (EIP) – View bound and unbound public IPs instantly.
The dashboard brings all your critical cloud information into a single, intuitive view — helping you stay informed and in control at all times.